
The Habesha News Desk
July 31, 2025
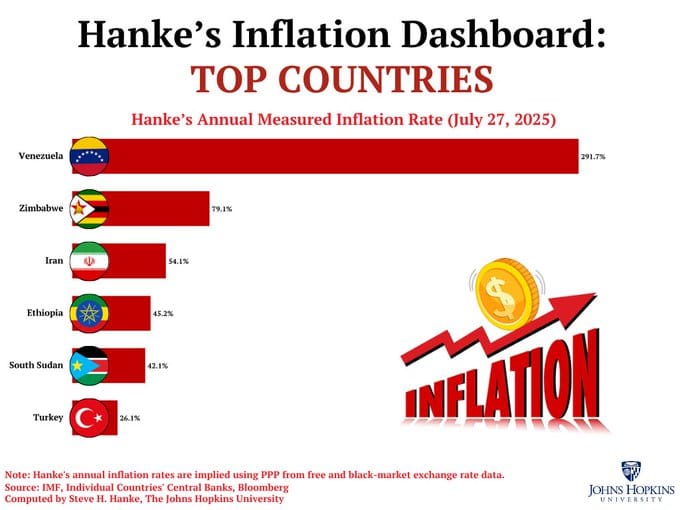
As of July 31, 2025, Ethiopia has climbed to fourth place on Steve Hanke’s Inflation Dashboard, recording an annual inflation rate of 45.2%. This marks a significant deterioration in the country’s economic stability and positions Ethiopia alongside the most inflation-ridden economies globally.
This Week’s Top Five Inflation Hotspots
According to economist Steve H. Hanke—who uses high-frequency exchange-rate data and purchasing power parity (PPP) instead of official CPI to track real inflation—this week’s top five countries with the worst inflation are:
-
Venezuela – 291.7% /yr
-
Zimbabwe – 79.1% /yr
-
Iran – 54.1% /yr
-
Ethiopia – 45.2% /yr
-
South Sudan – 42.1% /yr
Ethiopia’s entry into the top five underscores a worsening inflation trend that has gone underreported in traditional metrics.
Ethiopia: From Under the Radar to Crisis Mode
While Ethiopia is often omitted from discussions of global inflation leaders, Hanke’s PPP-based assessment reveals deep underlying economic stress. Key drivers include:
-
Persistent fiscal deficits
-
Supply chain disruptions, including fuel and food shortages
-
Heavy reliance on imports, which magnifies the impact of currency depreciation
-
Monetary instability, with significant expansion of the money supply
-
Conflict-related economic strain, particularly in the aftermath of the Tigray crisis
Unlike official CPI estimates, which may understate inflation by focusing on select consumer baskets, PPP-based calculations capture the broader erosion of purchasing power—especially in black-market or informal transactions.
Why Hanke’s Method Stands Out
Steve Hanke’s inflation model is built on:
-
Market exchange rates and PPP: Tracking price trends through the exchange rate between a local currency and the U.S. dollar.
-
All-goods, all-assets approach: Unlike CPI, which focuses on a limited basket of goods, Hanke’s model includes a wider economic view.
-
Real-time accuracy: By using current market data, Hanke’s figures often precede or contradict official government statistics, which may be delayed or politically influenced.
Institutions like the Cato Institute, Mises Institute, and Libertad y Progreso have praised Hanke’s dashboard as a more honest and timely inflation tracker for crisis economies.
Global Context
Ethiopia’s inclusion in the list marks a shift in the geography of inflation, showing that East Africa is not immune to the inflation crises typically associated with Latin America or failed Southern African states. Hanke’s method also flags that the official inflation data from many countries significantly understates the true economic pain felt by citizens.
Ethiopia’s 45.2% inflation rate now exceeds that of several traditionally unstable economies like Lebanon, Argentina, or Myanmar, according to recent PPP-based measurements.
Conclusion
Ethiopia’s appearance in Hanke’s Top 5 Inflation Dashboard is a warning sign for policymakers, investors, and the international community. While the country’s official statistics may suggest a less dire picture, the erosion of the birr’s purchasing power tells a different story.
Hanke’s dashboard pulls the curtain back on underreported inflation and provides a clearer picture of how economic mismanagement, conflict, and monetary policy can quickly destabilize even relatively large economies.
As inflation continues to surge in Ethiopia, immediate steps—such as monetary tightening, fiscal discipline, and market liberalization—will be crucial to reversing the trend and restoring stability.